

EO4SD forest management
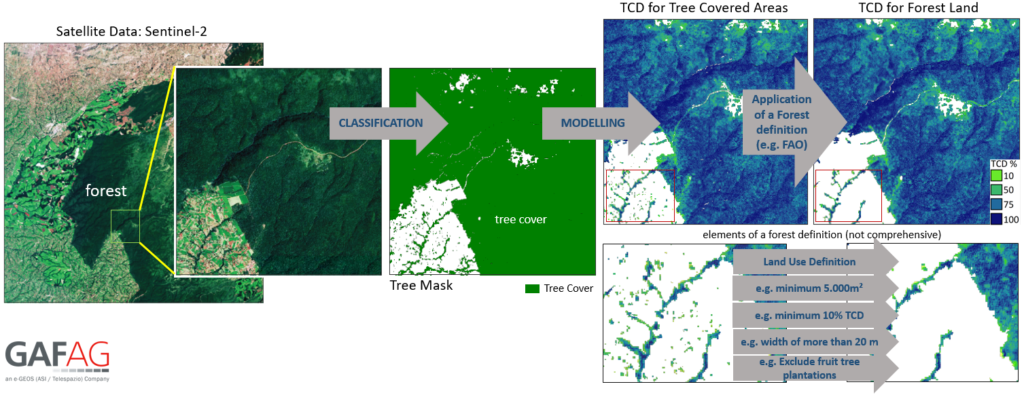
The Tree Cover Density (TCD) product is directly derived from high resolution (HR) satellite data and provides information on the proportional canopy coverage per satellite pixel in a range of 0 to 100%. When the TCD assessment is based on the Copernicus Sentinel-2 satellite imagery then the information can be provided in a 10m by 10 m resolution on a regular basis in a spatially explicit wall-to-wall representation.
The TCD product is a key input/ precursor for deriving forest maps following a specific forest definition, e.g. FAO definition, national definition. By applying geo-spatial operations with key parameters of forest definitions, like minimum area, minimum width and minimum canopy cover density, very accurate forest area maps can be achieved.
A Tree Cover Change product is derived by combining satellite data from two points in time for a direct classification of stable tree covered areas, stable non tree covered areas and change areas (tree cover loss and tree cover gain). The Tree Cover Densities are then modelled on the Tree Cover Change product based on the later point in time.
The Tree Cover Density product can be used as an input for:
- Assessment of Activity Data for REDD+.
- Analysis of Degradation and Deforestation.
- Sustainable Forest Management (SFM).
- Forest Landscape. Restoration (FLR).
- Identification of High Carbon Stock (HCS) forests.
- Forest management/ planning.
- Input variable to spatially explicit modelling of forest biomass and change.
PRODUCT SPECIFICATIONS
CONTENT
- Detailed mapping of tree cover density (in percent) over a certain area using discrete classess ranging from 1 to 100%.
- Tree Cover Changes can be mapped between two or more points in time, showing increase and decrease of tree covered areas (loss and gain).
GEOGRAPHICAL COVERAGE
Regional, National, Sub-national and Local.
TEMPORAL COVERAGE & FREQUENCY
Historical data and/or specific dates; Continuous update is possible (e.g. every 12 months, 5 years), depending on availability of satellite data.
EO DATA AND SPATIAL RESOLUTION
High Resolution (HR) satellite data,
e.g. Sentinel-2 with 10 m resolution, historic Landsat data with 30 m resolution.
ACCURACY
Overall thematic accuracy: > 85 – 90%.
Positional accuracy: < 1 pixel of source imagery
PRODUCT DELIVERY
AVAILABLE FORMATS
- Geodata in GeoTIFF, ASCIL or similar, accompanied with metadata (INSPIRE or ISO)
- As cartographic products in .pdf, .png or similar
DATA ACCESS OPTIONS
- USB, Hard disc.
- Download from a dedicated password protected ftp server or cloud platform.
- Data can be viewed online through a dedicated password protected web portal (OGC conform). The web potal can be customized to include various online analysis options, time series plots, statistical plots and to integrate user defined datasets.
SUPPORT AVAILABLE
- Quality Management Systems are applied to cover non-conformance issues, timely corrective actions, and supporting services related to reliability, flexibility and timely delivery of services. All quality relevant information and quality checks are documented and cover the categories:
- Compliancy of output with user requirements
- Completeness
- Thematic accuracy
- Thematic completeness
- Positional accuracy
- Product utility
- Tailored training can be provided on product use and integration for further geospatial analysis